Ethereum price down after new all-time high above $4,900, can it crash?
Ethereum’s price has slipped nearly 5% after hitting a new all-time high of $4,946 earlier today.
Summary
- Ethereum price has cooled off after hitting an all-time high on Aug. 25.
- Historical data suggests that September could be bearish for ETH.
- Technicals portray a contrasting outlook as ETH trades within an ascending channel on the daily chart.
According to data from crypto.news, Ethereum (ETH) price rallied over 21% to hit a new all-time high of $4,946 on Aug. 25 before settling down at $4,713 as of press time. At this price, it remains 26% above since the beginning of August and 220% from its year-to-date low.
Despite the strong gains posted by the leading altcoin by market cap in August, historical data suggests that the upcoming month could likely be bearish for it.
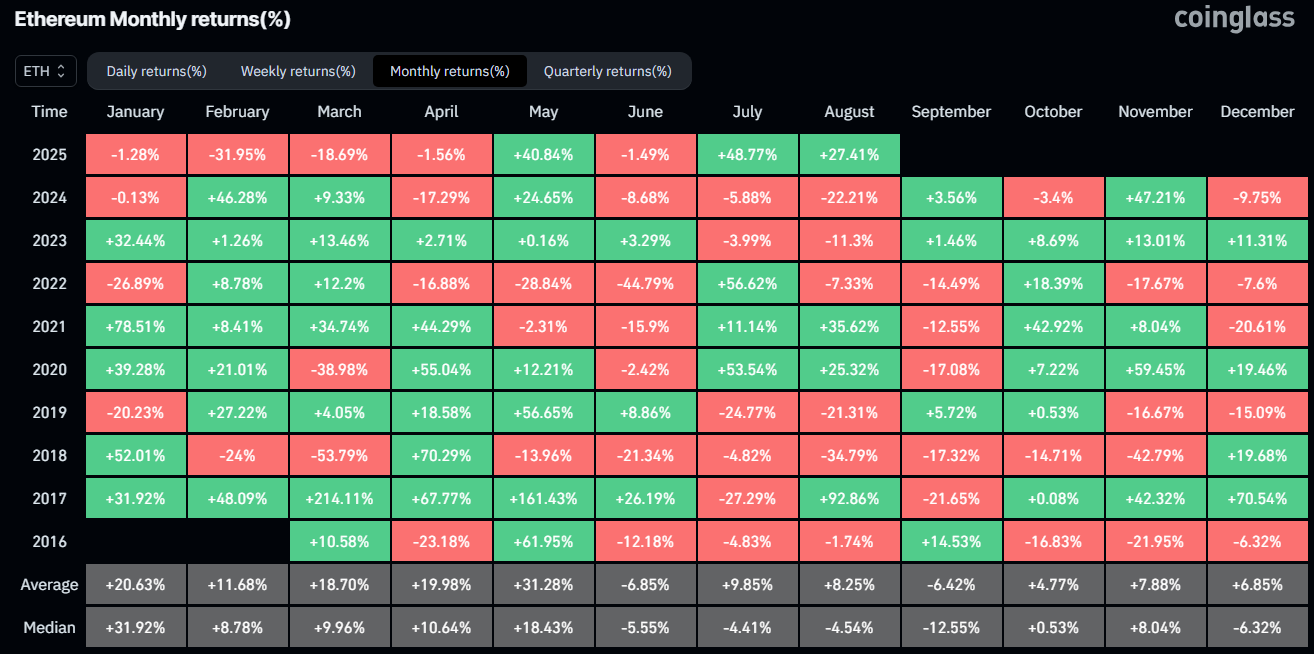
A look at data from CoinGlass shows that since 2016, each time Ethereum recorded gains in August, it was followed by a decline in September. More specifically, ETH posted gains of 92.86%, 25.3%, and 35.6% in August of 2017, 2020, and 2021, while the respective Septembers recorded declines of 21.65%, 17.08%, and 12.55%.
Such a scenario is further supported by the fact that ETH remains close to its all-time high levels. Cryptocurrencies typically tend to face some sell-off after hitting a new peak, as early investors begin to book profits.
Meanwhile, data from CoinGlass shows that Ethereum’s sharp drop from its new high was triggered by a wave of long liquidations, as overleveraged positions were flushed near the top. In the past 24 hours, total liquidations for ETH stood at $216 million, with nearly $130 million coming from long positions.
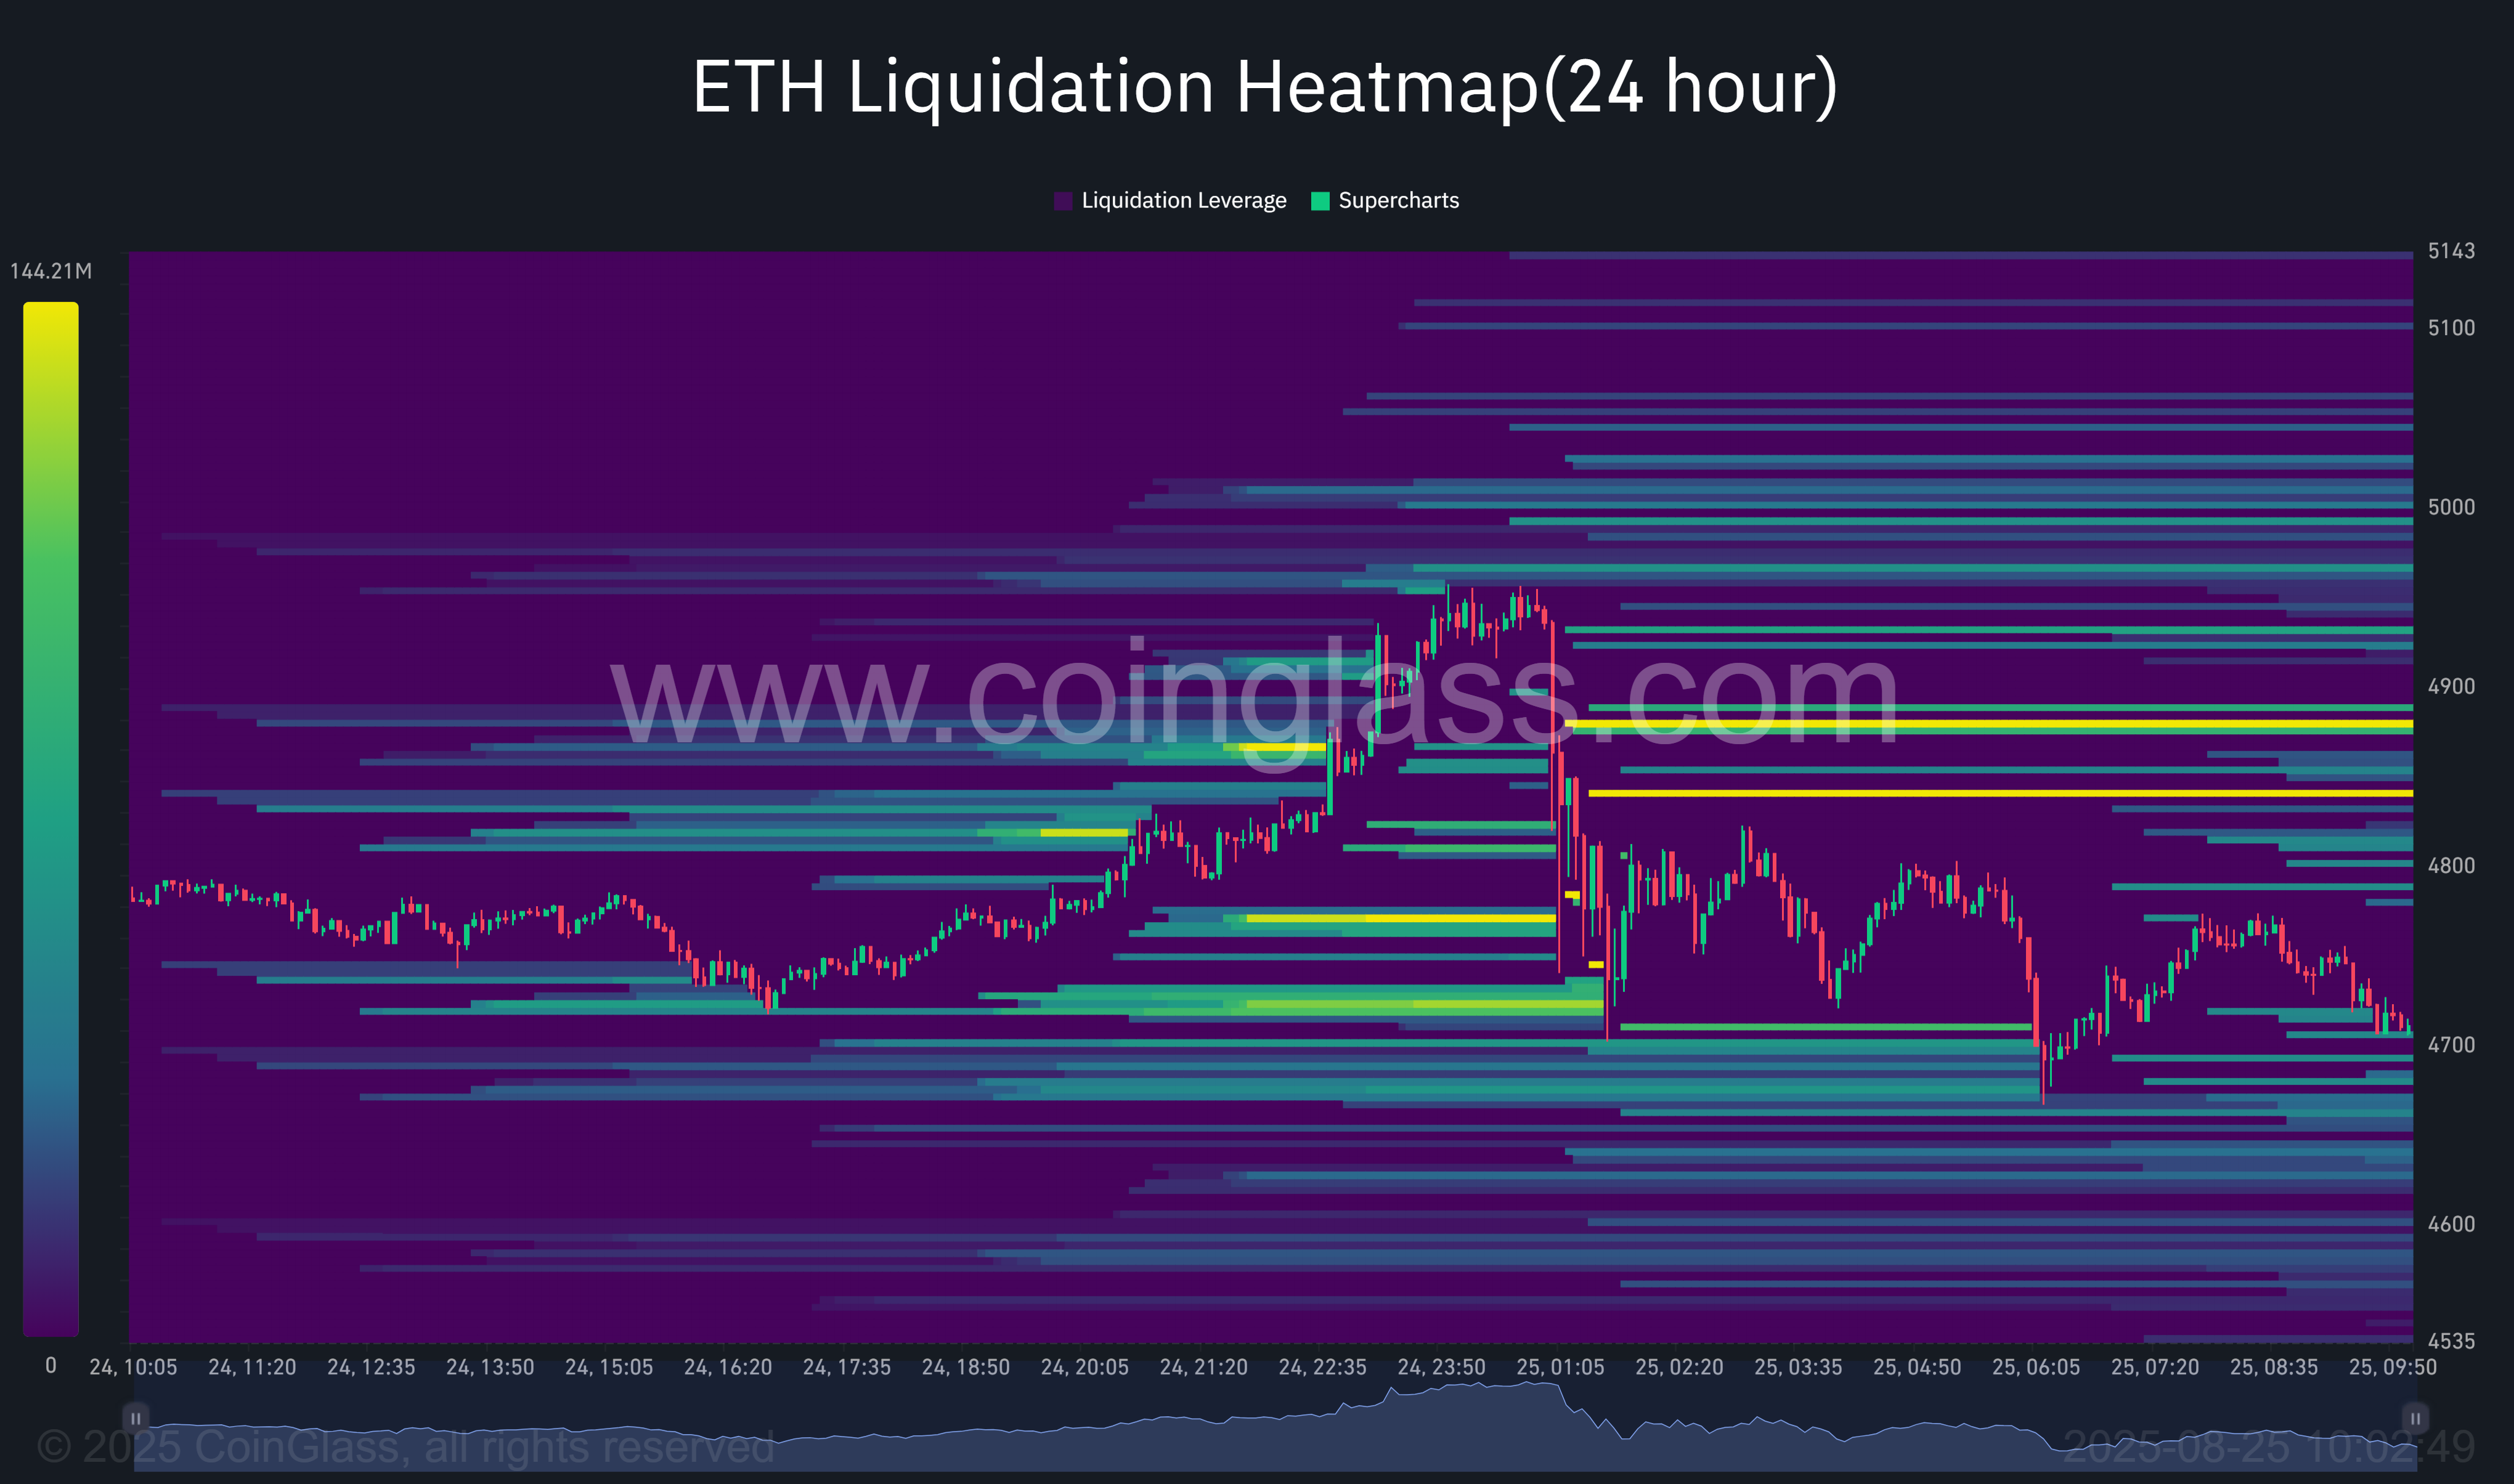
As of press time, dense liquidation zones remain clustered above $4,900. Any renewed attempt to break higher could spark another liquidation cascade. If this occurs, ETH may slip further toward the $4,600–$4,680 range.
Nevertheless, unlike in previous cycles, Ethereum could enter the coming September under a different macro environment, one marked by the presence of spot Ether ETFs and corporate treasuries holding ETH, both of which were absent during past August rallies.
The nine-spot Ether funds have attracted $2.79 billion in inflows in August, following $5.43 billion in the previous month, reflecting strong demand for Ether among institutional investors. This stands in contrast to their Bitcoin counterparts, which have seen outflows totaling $1.19 billion this month.
Adding to the shift in market dynamics, Ether has emerged as one of the most closely watched crypto assets this month, bolstered by regulatory momentum, and a wave of corporate accumulation.
On the daily chart, Ethereum has been trading within an ascending parallel channel since late June, characterized by higher highs and higher lows within two upward-sloping trendlines. This structure typically signals a continuation of the prevailing bullish trend, provided price remains confined within the channel.
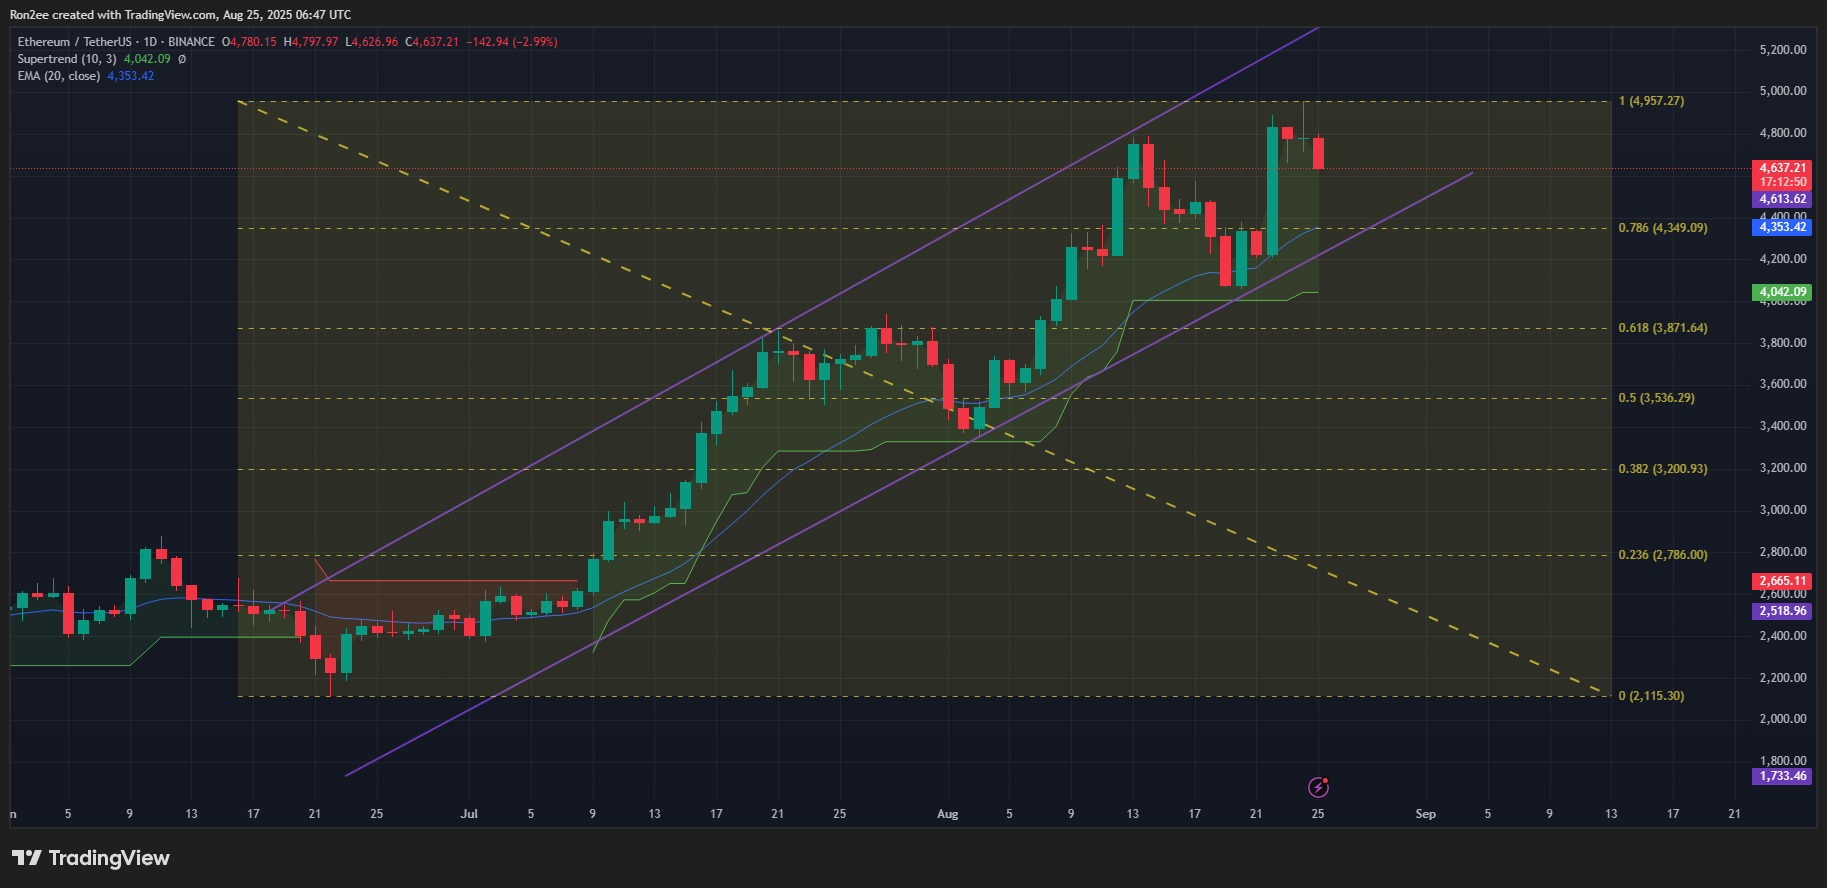
As of press time, Ethereum was consolidating near the midline of the channel, suggesting a period of equilibrium between buying and selling pressure. Notably, the token continues to trade above the 20-day exponential moving average, a sign that short-term momentum remains in favor of the bulls.
Additionally, the Supertrend indicator has flipped green and positioned itself below the price, offering another bullish confirmation.
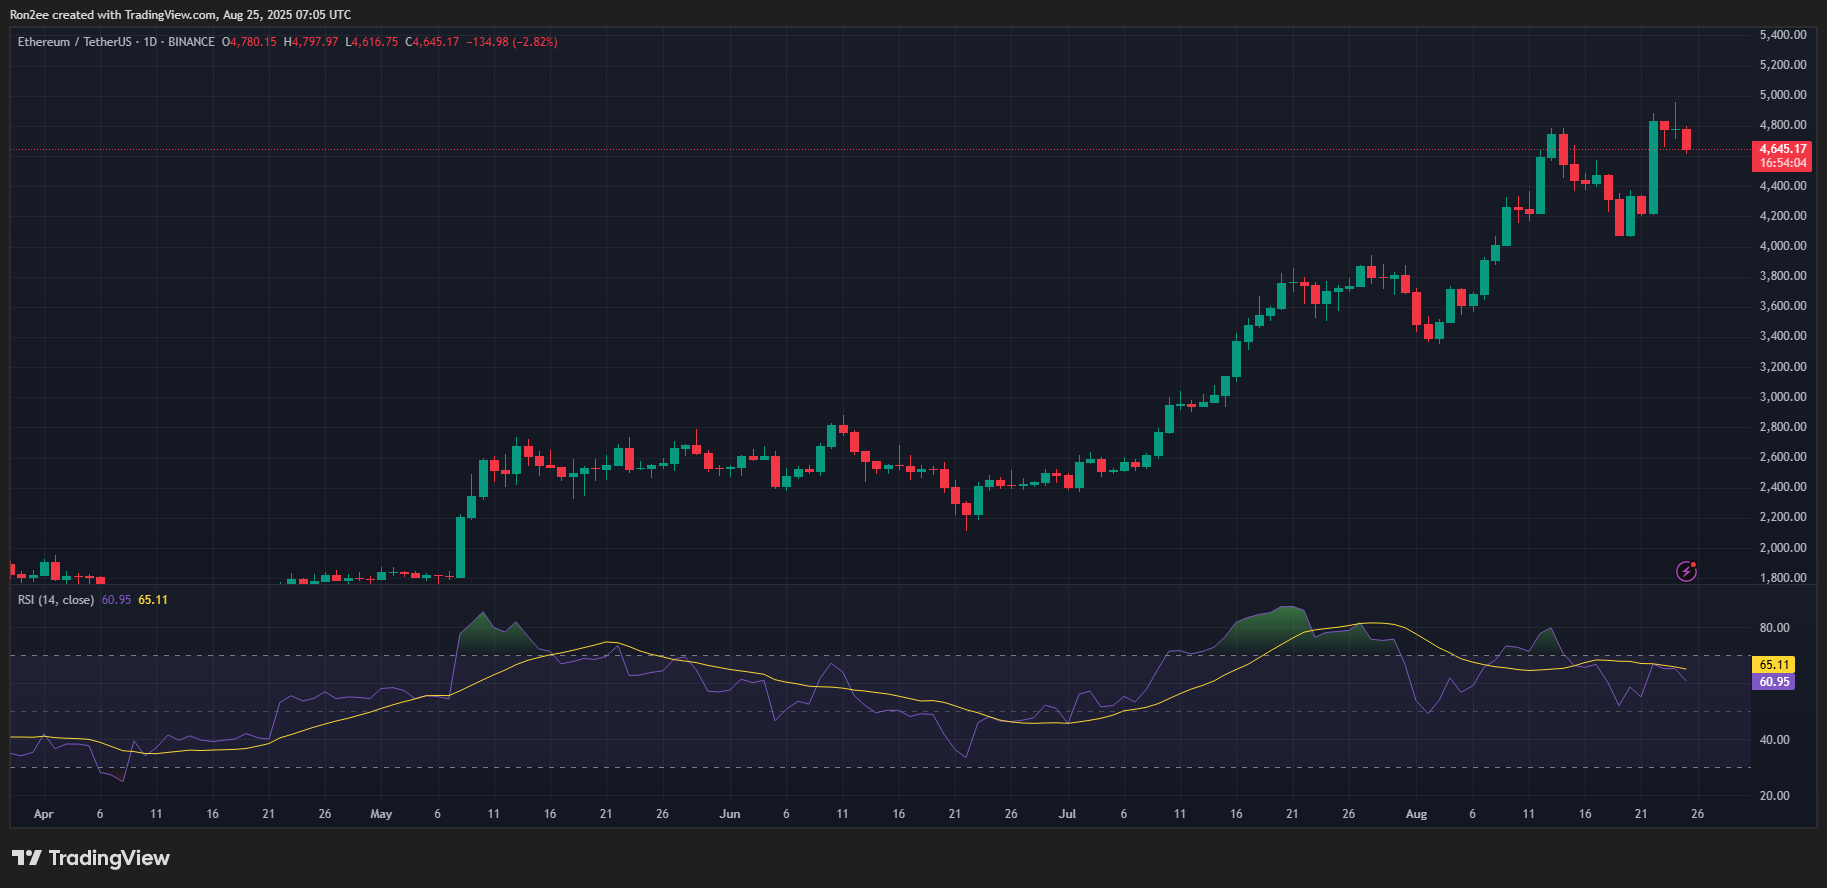
Meanwhile, the Relative Strength Index has dropped to a reading of 60, indicating that bullish momentum persists, but without entering overbought territory. This suggests that Ethereum still has room to advance before facing buyer exhaustion.
If bullish momentum continues, the next major upside target lies at $5,200, which represents a 10% gain from the current level and marks the upper boundary of the channel. A breakout above this level could accelerate further gains, particularly if accompanied by strong volume.
On the downside, immediate support is found at $4,349, a level that aligns with the 78.6% Fibonacci retracement of the most recent upward swing.
A break below this level would invalidate the current pattern and could trigger a deeper correction toward the lower boundary of the channel.
Disclosure: This article does not represent investment advice. The content and materials featured on this page are for educational purposes only.